Services Details

Organizational Performance Management (OPM)
1. ITIC facilitates design and implementation of intelligent OPM framework, in alignment with the organizational vision and strategic objectives.
OPM challenges faced by most organizational, include, but are not limited to
- Dashboards and Scorecards misalignment
- Manual data entry
- Unavailability of reliable data
- Lack of strategic objectives
- Mismatch with ERM framework
ITIC OPM intervention will result in following benefits
- Strategic alignment
- Embedding ERM
- Effective program management
Data Analytics and Visualization
In today’s data-driven world, organizations across industries are faced with vast amounts of data generated from various sources such as transactions, customer interactions, sensors, and social media. DAV services empower organizations to harness the full potential of their data and drive innovation, growth, and success. By partnering with ITIC, organizations can unlock actionable insights, make informed decisions, and stay ahead of the competition.
Data analytics is the process of examining this data to uncover meaningful insights, patterns, and trends that can inform decision-making and drive business success.
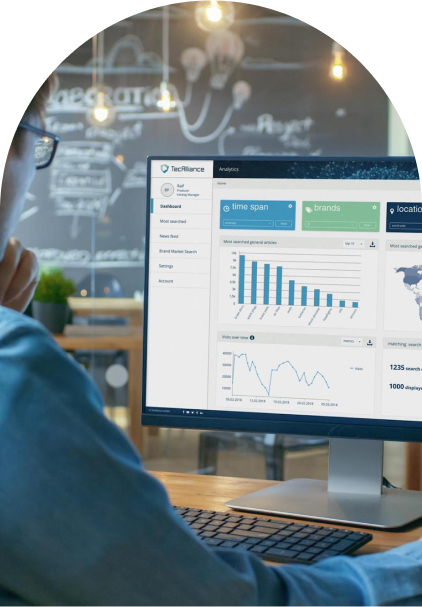
Data visualization plays a crucial role in communicating insights effectively. Charts, graphs, dashboards, and interactive visualizations are used to present complex data in a visually appealing and understandable format.
Data Analytics Services
Data analytics services involve the process of examining raw data to uncover patterns, trends, correlations, and other valuable insights. These services typically encompass the following key components:
1. Data Collection and Integration
Data analytics services begin with collecting data from disparate sources such as databases, files, APIs, and streaming platforms. This data is then integrated and aggregated to create a unified dataset for analysis.
2. Data Preprocessing and Cleansing
Raw data often contains errors, missing values, outliers, and inconsistencies. Data preprocessing services involve cleaning, transforming, and standardizing the data to ensure its quality, consistency, and readiness for analysis.

3. Descriptive Analytics
Descriptive analytics focuses on summarizing historical data to understand what has happened in the past. It involves basic statistical analysis, data visualization, and reporting to provide insights into trends, patterns, and anomalies in the data.
4. Predictive Analytics
Predictive analytics services use statistical models and machine learning algorithms to forecast future trends, behaviors, or outcomes based on historical data. These services enable organizations to anticipate changes, identify opportunities, and mitigate risks proactively.
5. Prescriptive Analytics:
Prescriptive analytics services go a step further by recommending actions to optimize outcomes based on predictive insights. They help organizations make data-driven decisions by providing actionable recommendations and decision support tools.

Data Visualization Services
Data visualization services play a crucial role in communicating insights effectively and facilitating decision-making. These services focus on transforming complex data into visual representations such as charts, graphs, dashboards, and interactive reports. Key aspects of data visualization services include:
1. Visual Exploration and Discovery
Data visualization services enable users to explore and interact with data visually to discover meaningful insights and patterns. Interactive features such as filtering, drill-downs, and tooltips enhance the exploration process and facilitate deeper insights.
2. Customized Dashboards and Reports
Data visualization services create customized dashboards and reports tailored to the specific needs and requirements of stakeholders. These dashboards provide at-a-glance summaries of key metrics, trends, and KPIs, allowing stakeholders to monitor performance and track progress towards goals.

3. Interactive Data Visualizations
Interactive data visualizations engage users by allowing them to interactively explore and analyze data. Features such as hover effects, click-throughs, and dynamic filters enable users to dive deeper into the data and gain actionable insights.
4. Data Storytelling
Data visualization services leverage storytelling techniques to convey insights in a compelling and persuasive manner. They use narratives, annotations, and visual cues to guide users through the data story and communicate key messages effectively
5. Mobile and Responsive Design
With the increasing use of mobile devices, data visualization services prioritize mobile-friendly and responsive designs. They ensure that visualizations are accessible and usable across devices of varying screen sizes and resolutions.

Benefits of DAV Services
1. Informed Decision-Making
By leveraging data analytics and visualization services, organizations can make data-driven decisions based on evidence and insights rather than intuition or guesswork.
2. Improved Performance and Efficiency
Data analytics services help organizations identify inefficiencies, optimize processes, and improve performance across various functions such as marketing, operations, and finance.

3. Enhanced Customer Experience
By analyzing customer data and visualizing insights, organizations can better understand customer needs, preferences, and behaviors, leading to personalized experiences and improved customer satisfaction.
4. Competitive Advantage
Data analytics and visualization services enable organizations to gain a competitive edge by uncovering hidden opportunities, predicting market trends, and anticipating competitor moves.
5. Risk Mitigation
Predictive analytics services help organizations identify and mitigate risks by forecasting potential threats, vulnerabilities, and disruptions before they occur.

Resource Augmentation (RA)
ITIC is your one-stop partner for resource augmentaiton. Our pool of specialized vetted resources are available for short-term and long-term engagements.
Our committment to quality and 100% client satisfation is at the core of our service offerings. Our clients benefit from
- Pre-deployment screeing by client
- Proficiency in English
- Availability to work as per client timings
Free of cost resource substitution, in case of service delivery issues or other unforeseen circumstances.
